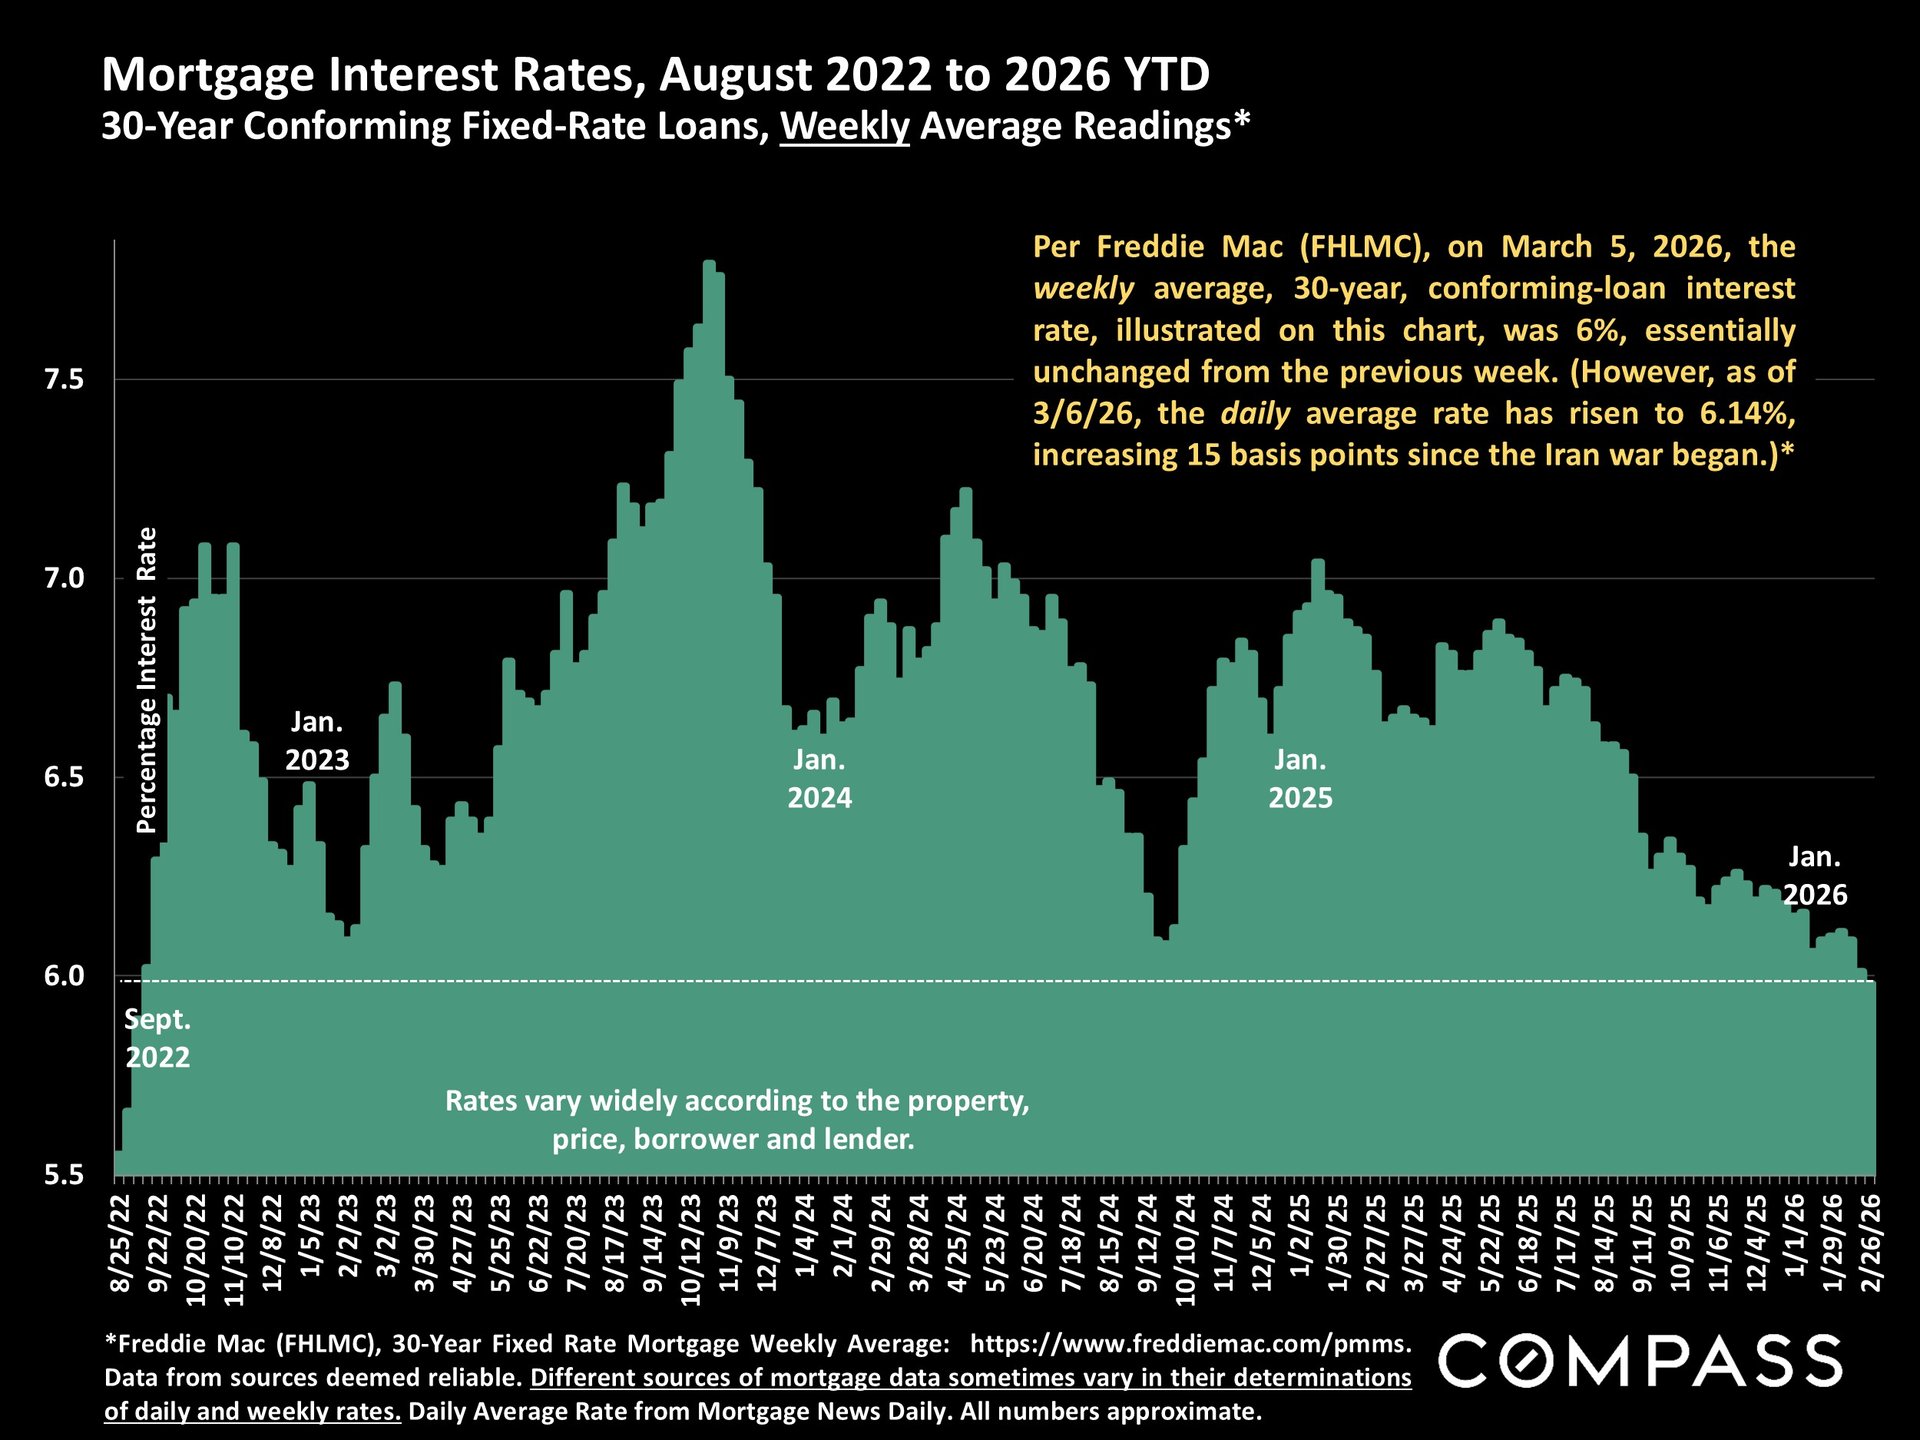
Mortgage Rates Remain Low, but Have Started to Edge Up
Per Freddie Mac, the weekly average 30-year conforming fixed rate on March 5, 2026 was 6.0%, essentially unchanged from the previous week. However, the chart notes that as of March 6, 2026, the daily average rate had increased to 6.14%, up 15 basis points since the Iran war began.
Looking at the broader August 2022-2026 chart:
-
Rates peaked well above current levels in late 2023.
-
They trended downward through late 2025 into early 2026.
-
Early March 2026 still shows rates near the low end of the recent multi-year range, despite the slight rebound.
Lower rates have supported buyer demand, even if recent geopolitical events are beginning to put upward pressure on borrowing costs.
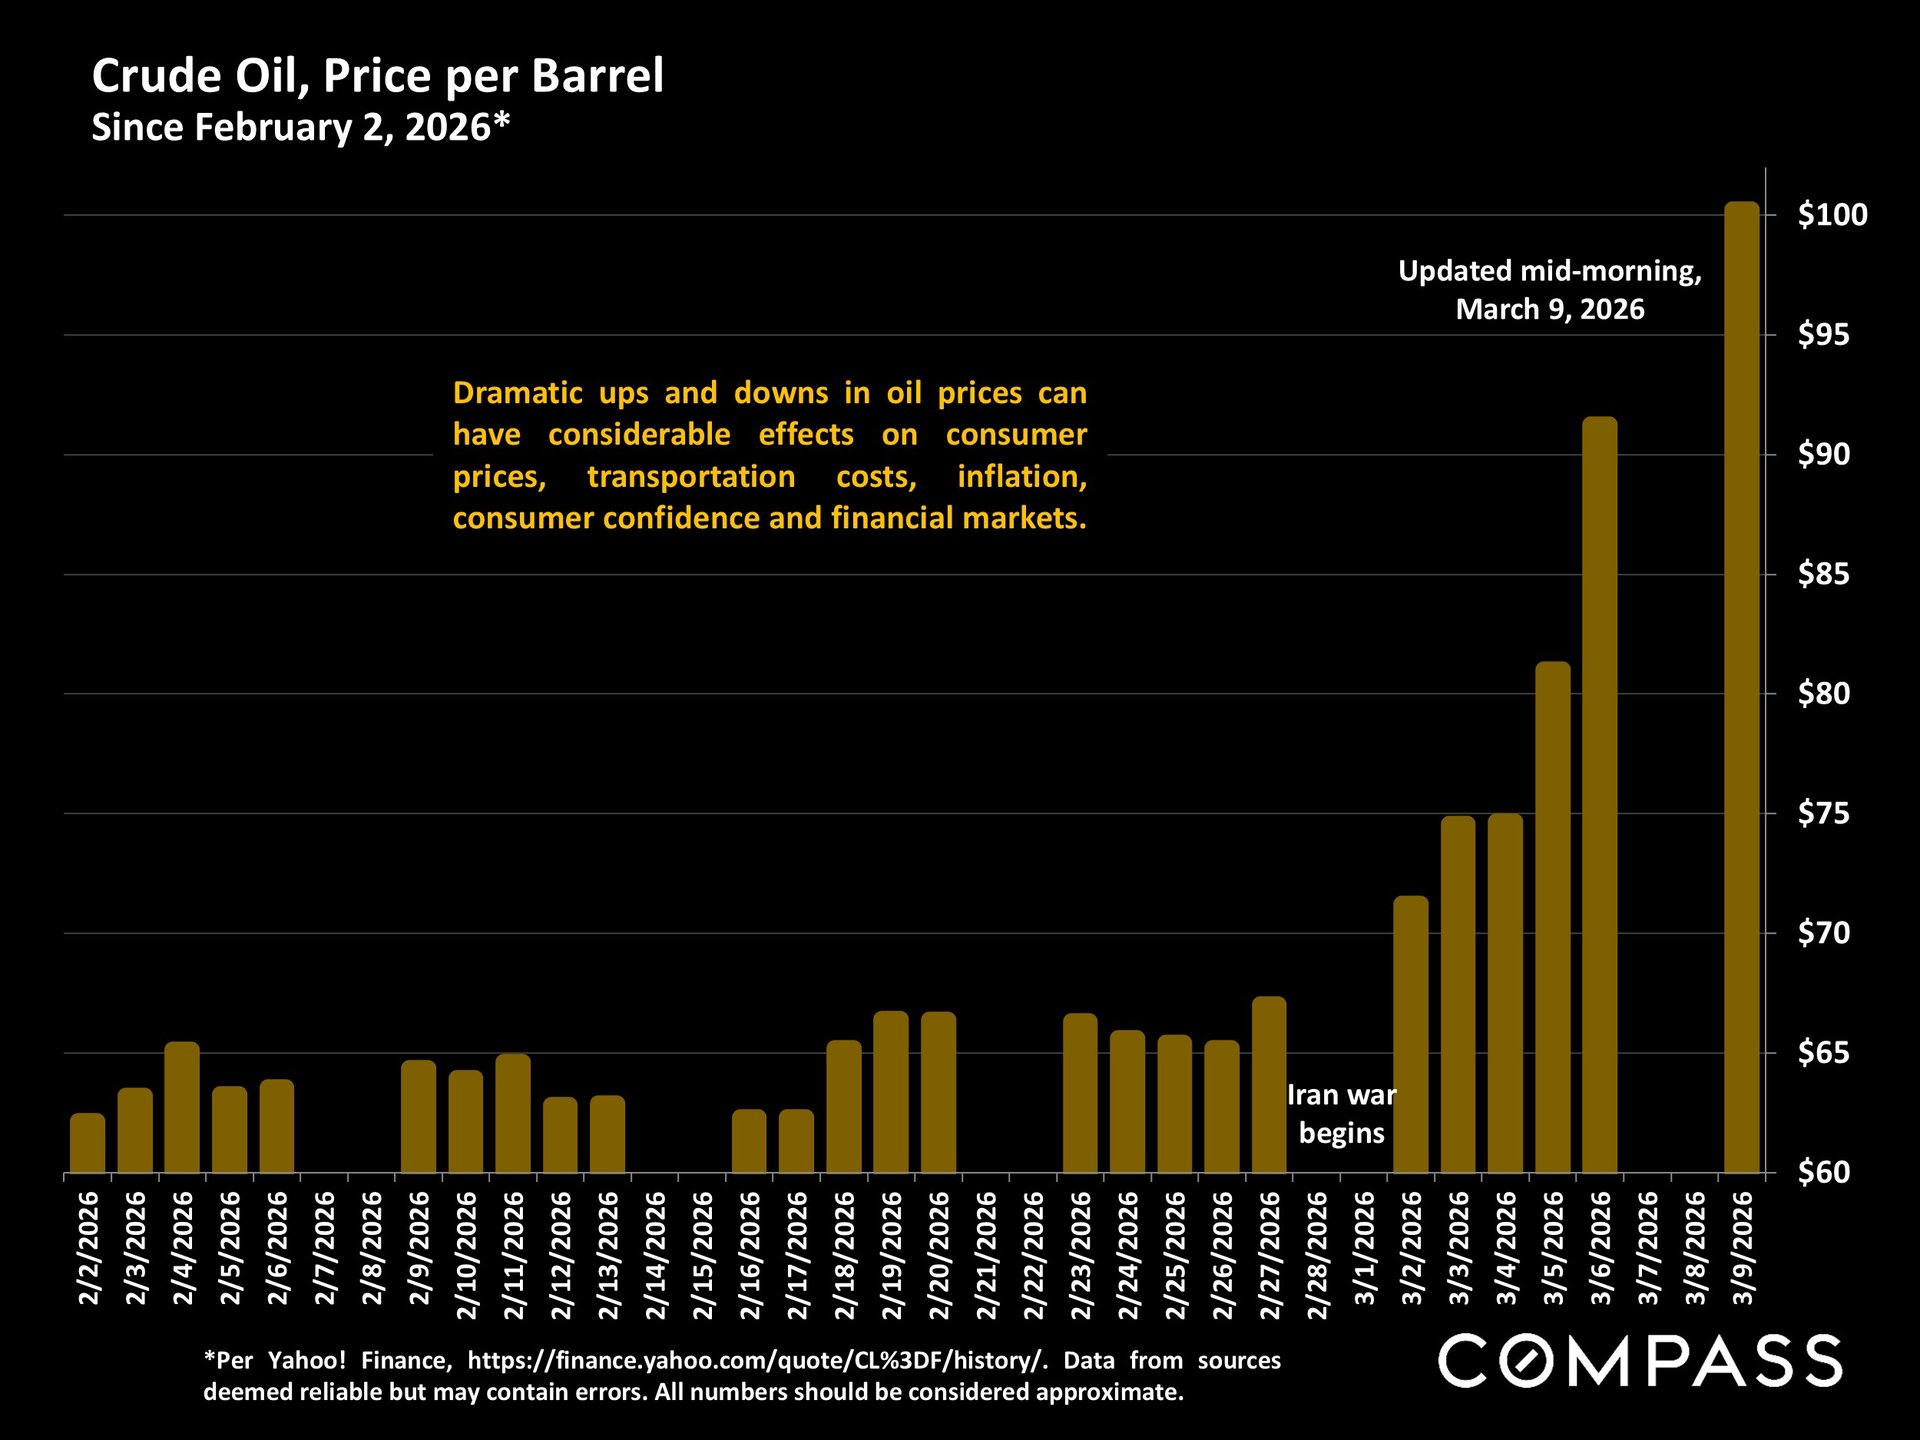
Oil Prices Have Spiked Sharply
The crude oil chart, updated mid-morning on March 9, 2026, shows a dramatic rise in oil prices after the Iran war began.
The slide notes that large swings in oil prices can affect:
-
Consumer prices
-
Transportation costs
-
Inflation
-
Consumer confidence
-
Financial markets
Oil rose from the low-to-mid $60s in February to approximately $100 per barrel by March 9, 2026. This is the clearest external risk factor shown in the images and may influence the market indirectly if it feeds into inflation or rate pressure.
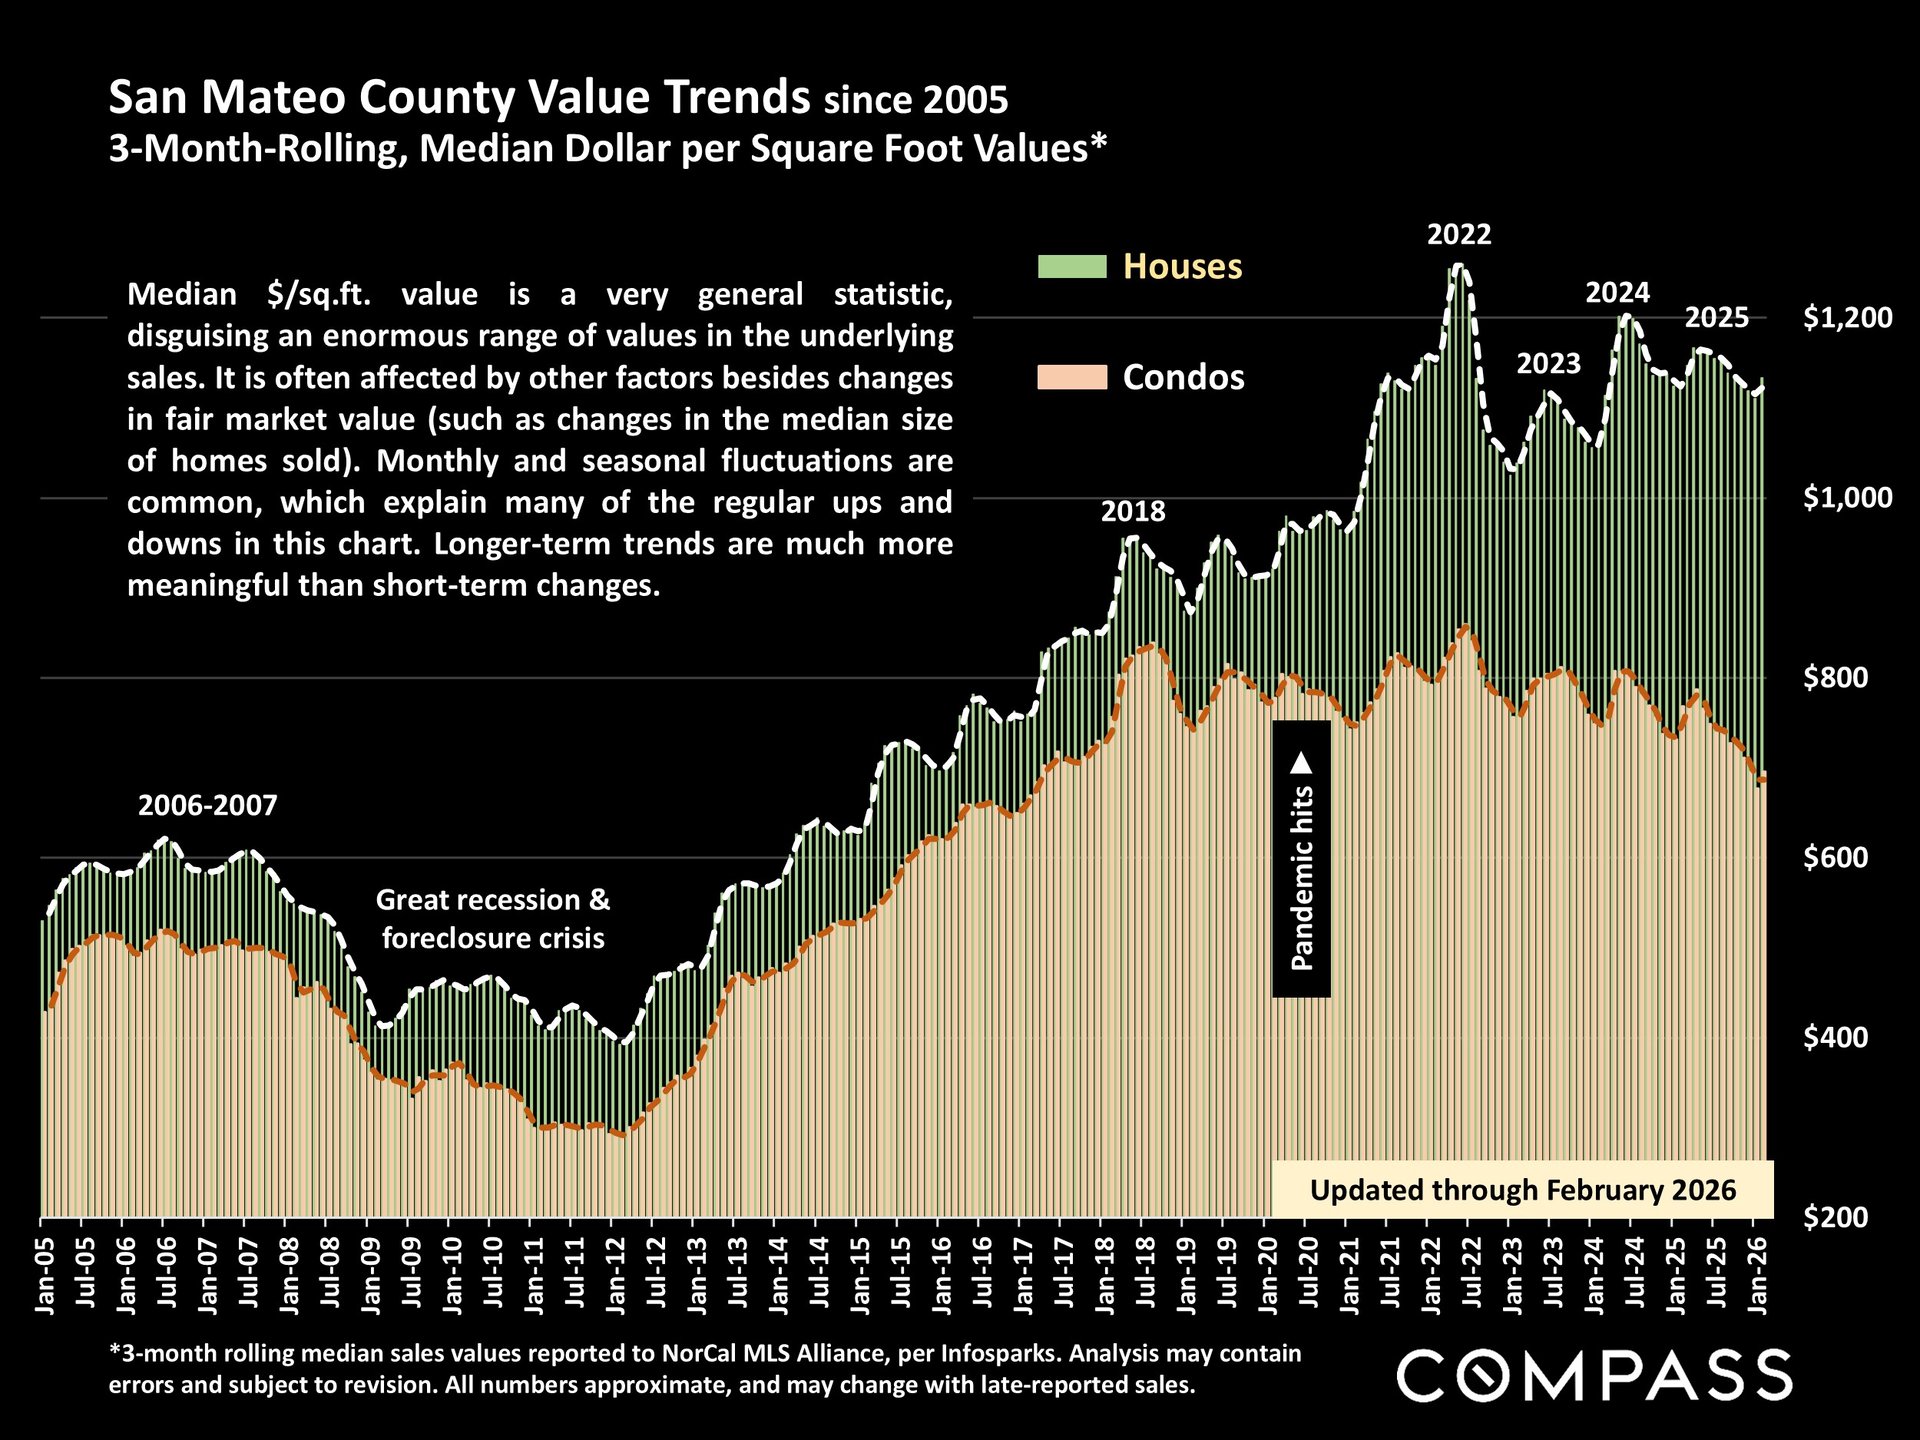
House Values Continue to Outperform Condo Values
The 3-month rolling median dollar-per-square-foot chart, updated through February 2026, continues to show a substantial long-term gap between houses and condos.
-
House values remain significantly above condo values.
-
Condo values continue to trail and show softer performance.
-
Seasonal fluctuations remain normal, but the longer-term trend is much stronger for houses.
This aligns with the narrative slide stating that houses are seeing much stronger market conditions than condos.
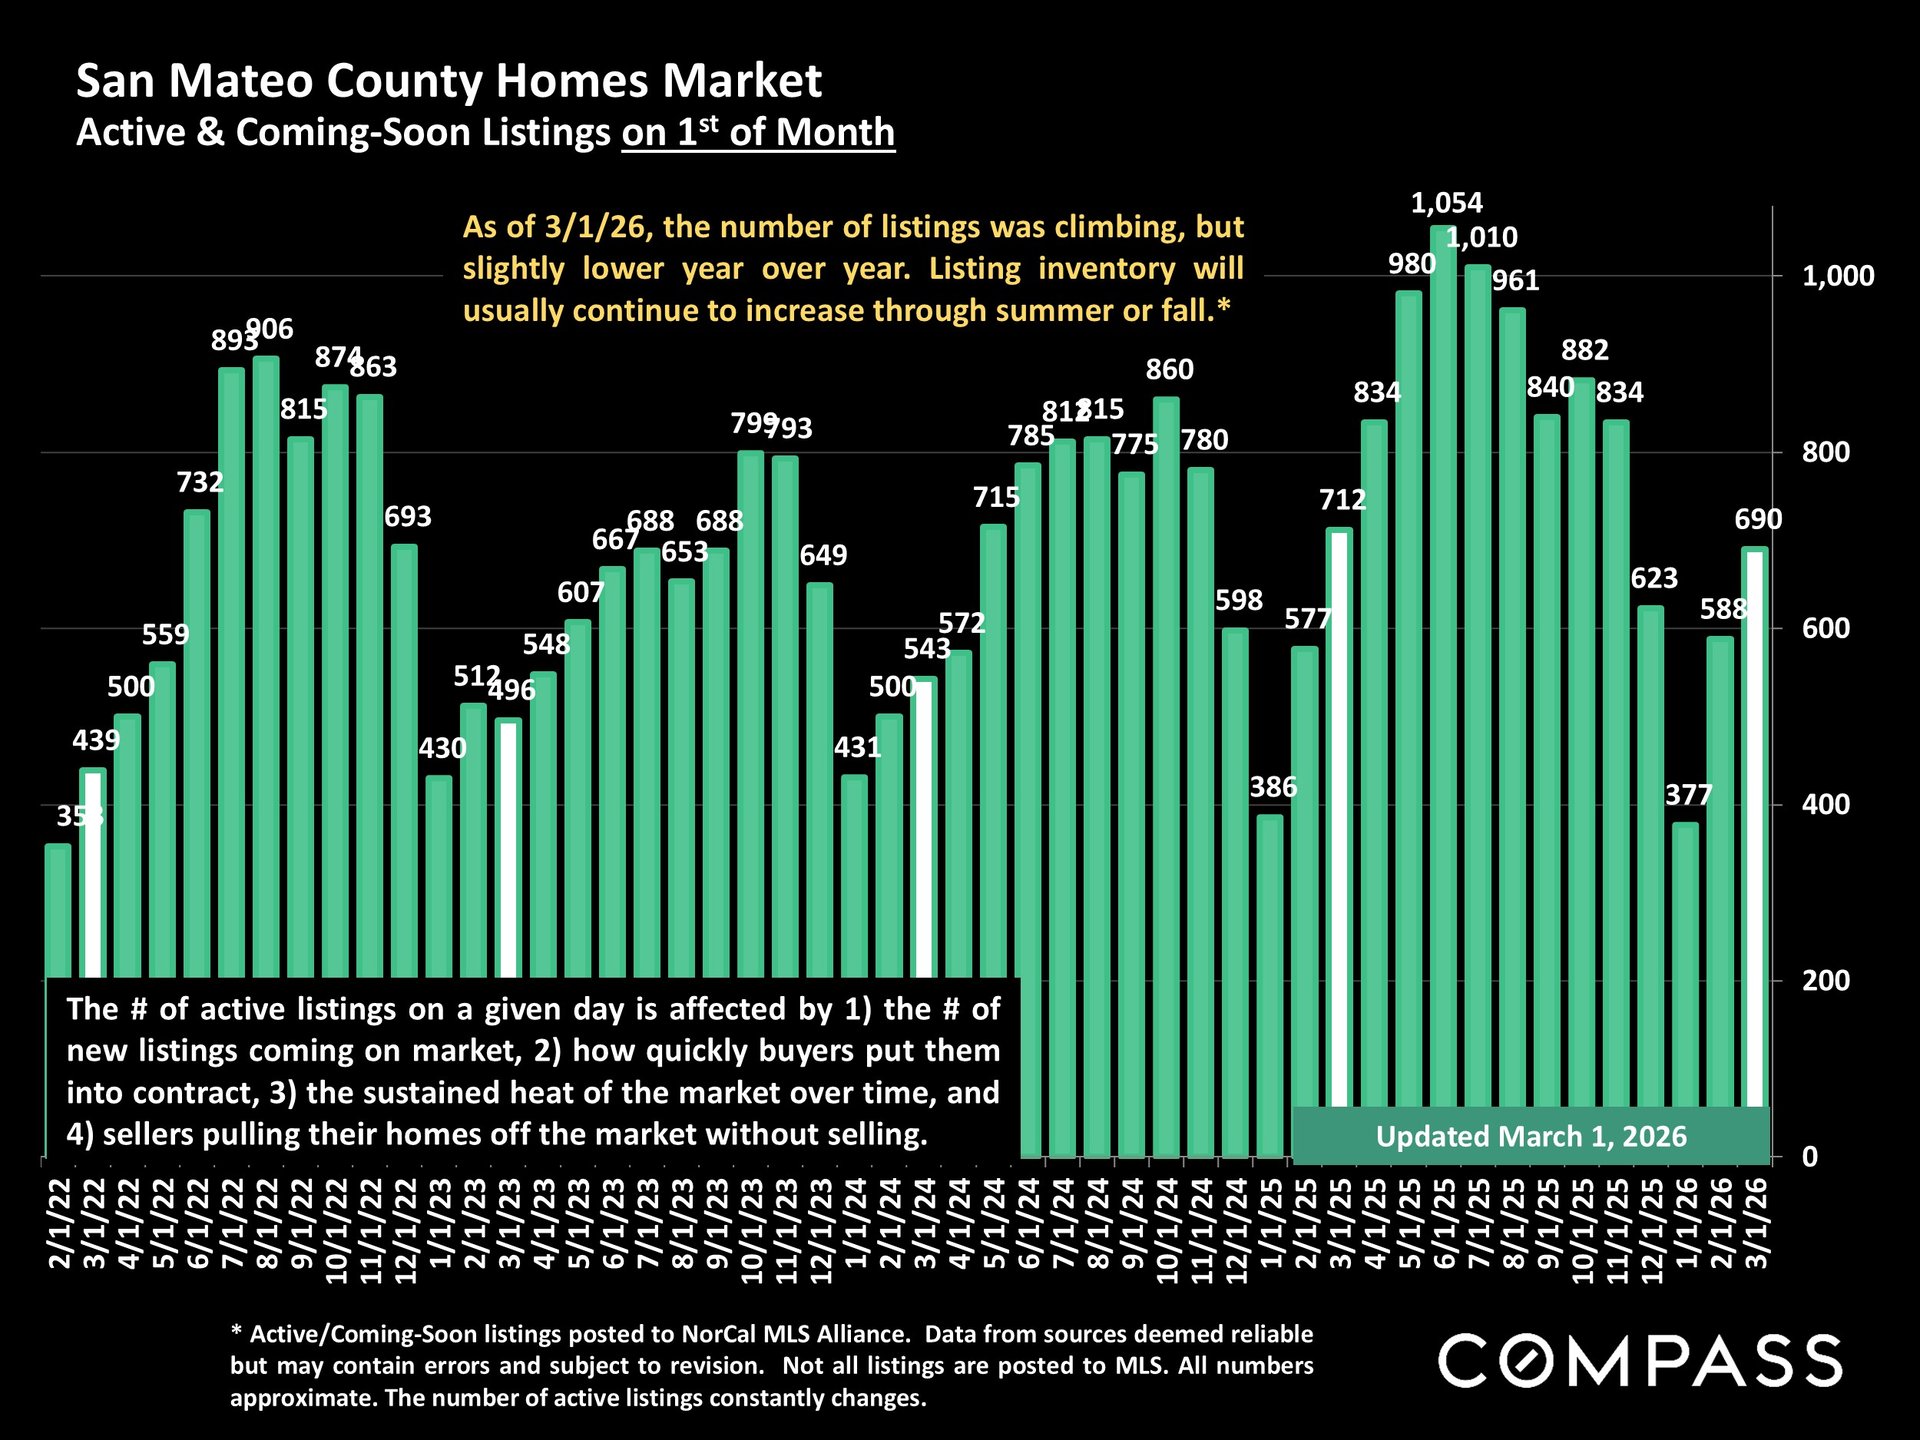
Inventory Is Rising Seasonally, but Remains Slightly Below Last Year
As of March 1, 2026, the number of active and coming-soon listings in San Mateo County was climbing, but was slightly lower year over year.
The chart indicates inventory typically continues to rise through summer or fall. As always, the number of active listings is shaped by:
-
The number of new listings coming on market
-
How quickly buyers put them into contract
-
The sustained heat of the market
-
Sellers pulling homes off market without selling
So while inventory is increasing seasonally, it still appears insufficient relative to buyer demand.
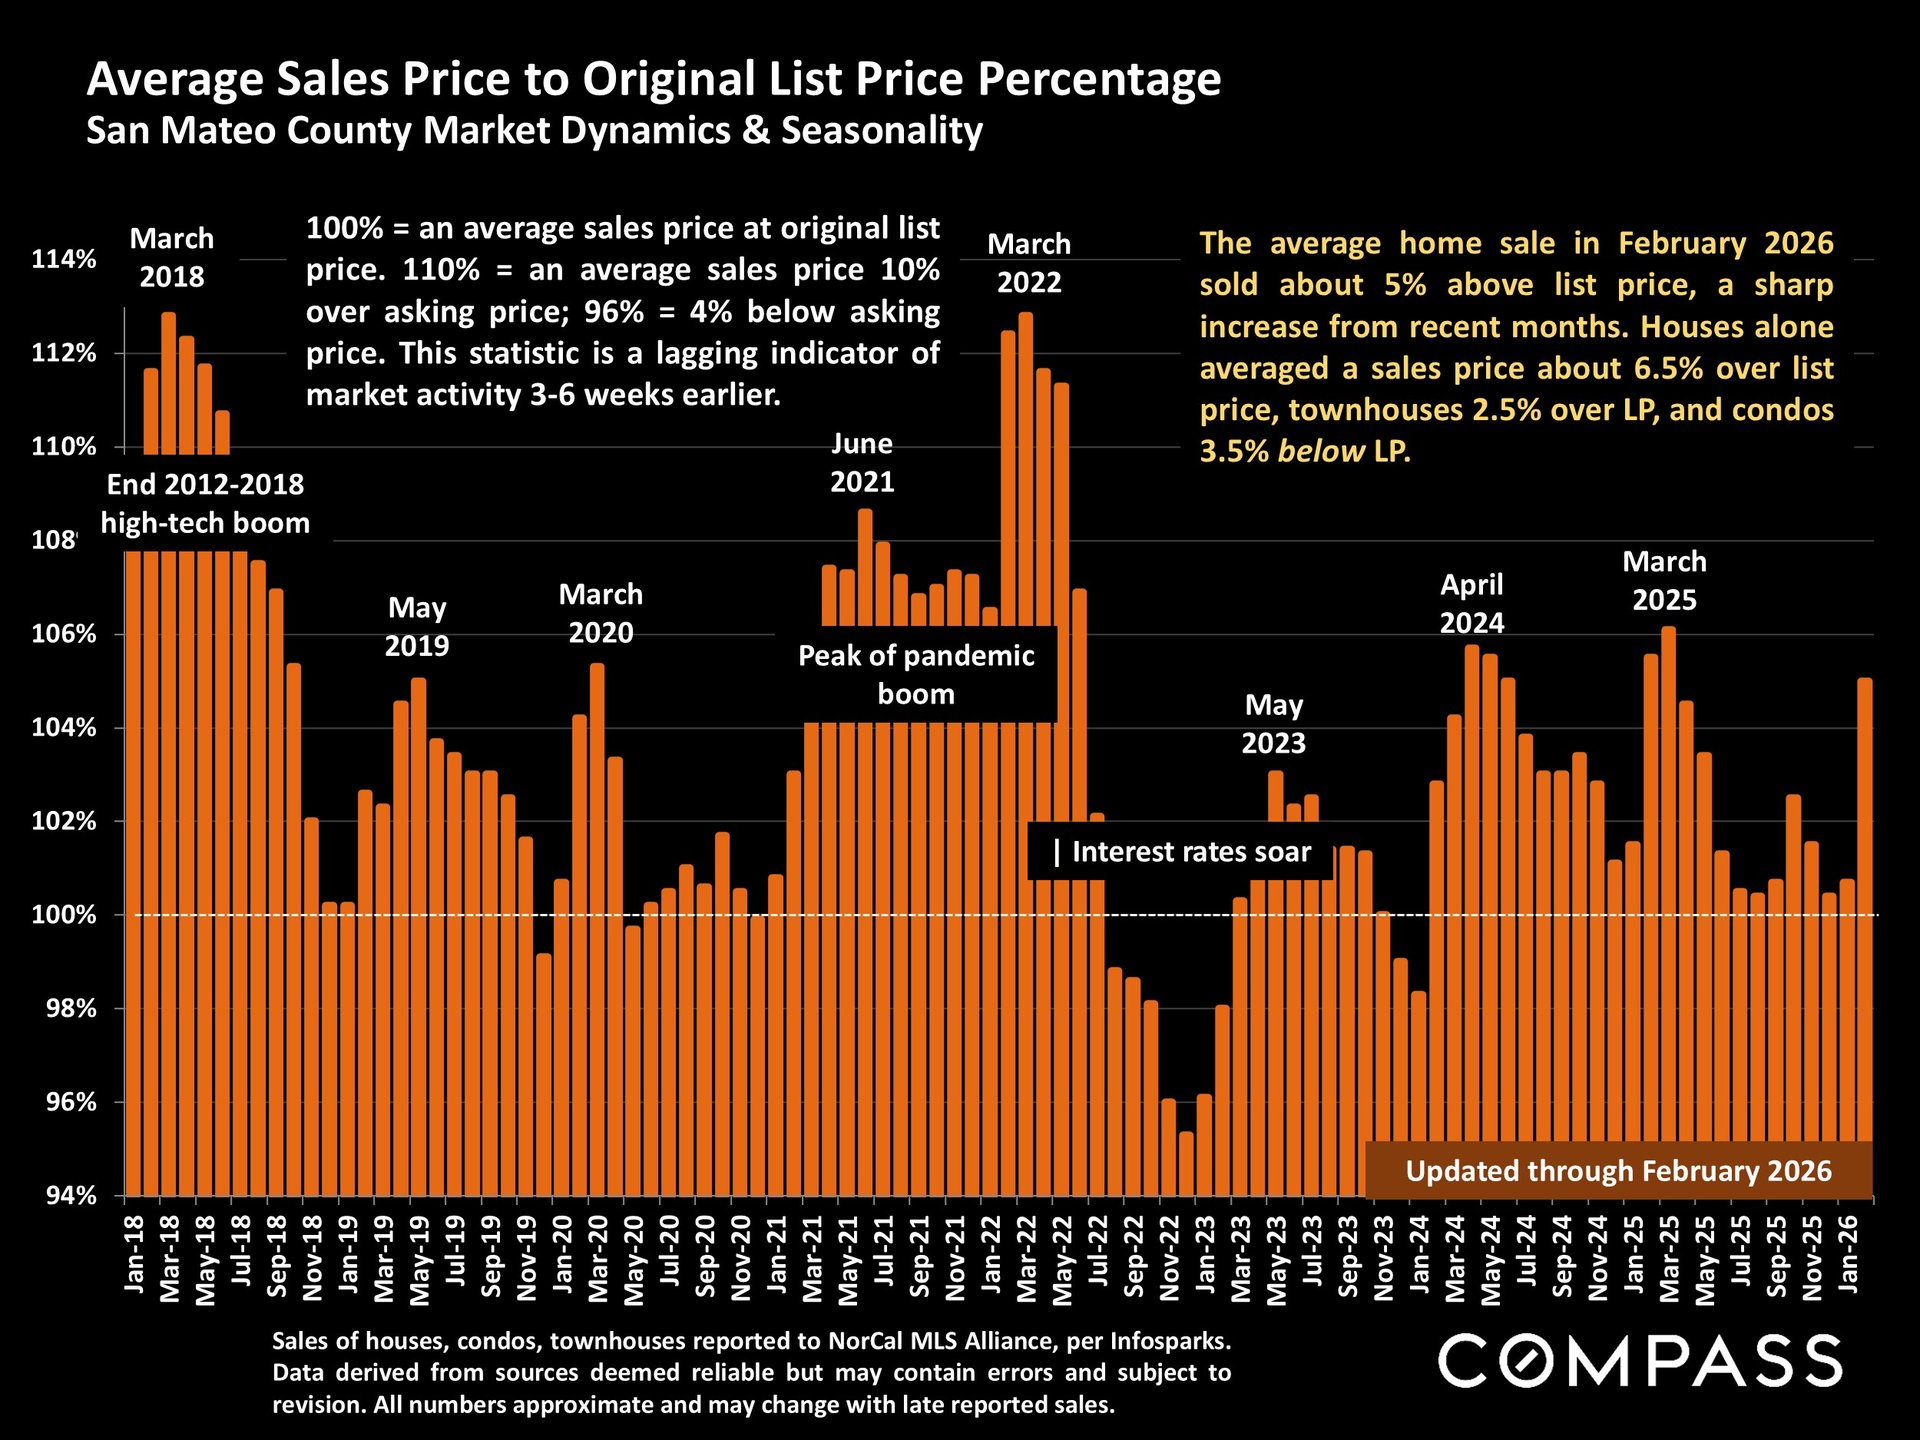
Overbidding Has Increased Sharply
The Average Sales Price to Original List Price Percentage chart, updated through February 2026, shows a notable jump in market competitiveness.
In February 2026:
-
The average home sale closed about 5% above list price
-
Houses alone averaged about 6.5% over list price
-
Townhouses averaged 2.5% over list price
-
Condos averaged 3.5% below list price
This is described in the chart as a sharp increase from recent months and reinforces the split between strong house-market conditions and weaker condo performance.
Because this metric is a lagging indicator of market activity 3–6 weeks earlier, it suggests the market had already been heating up noticeably by late January and early February.
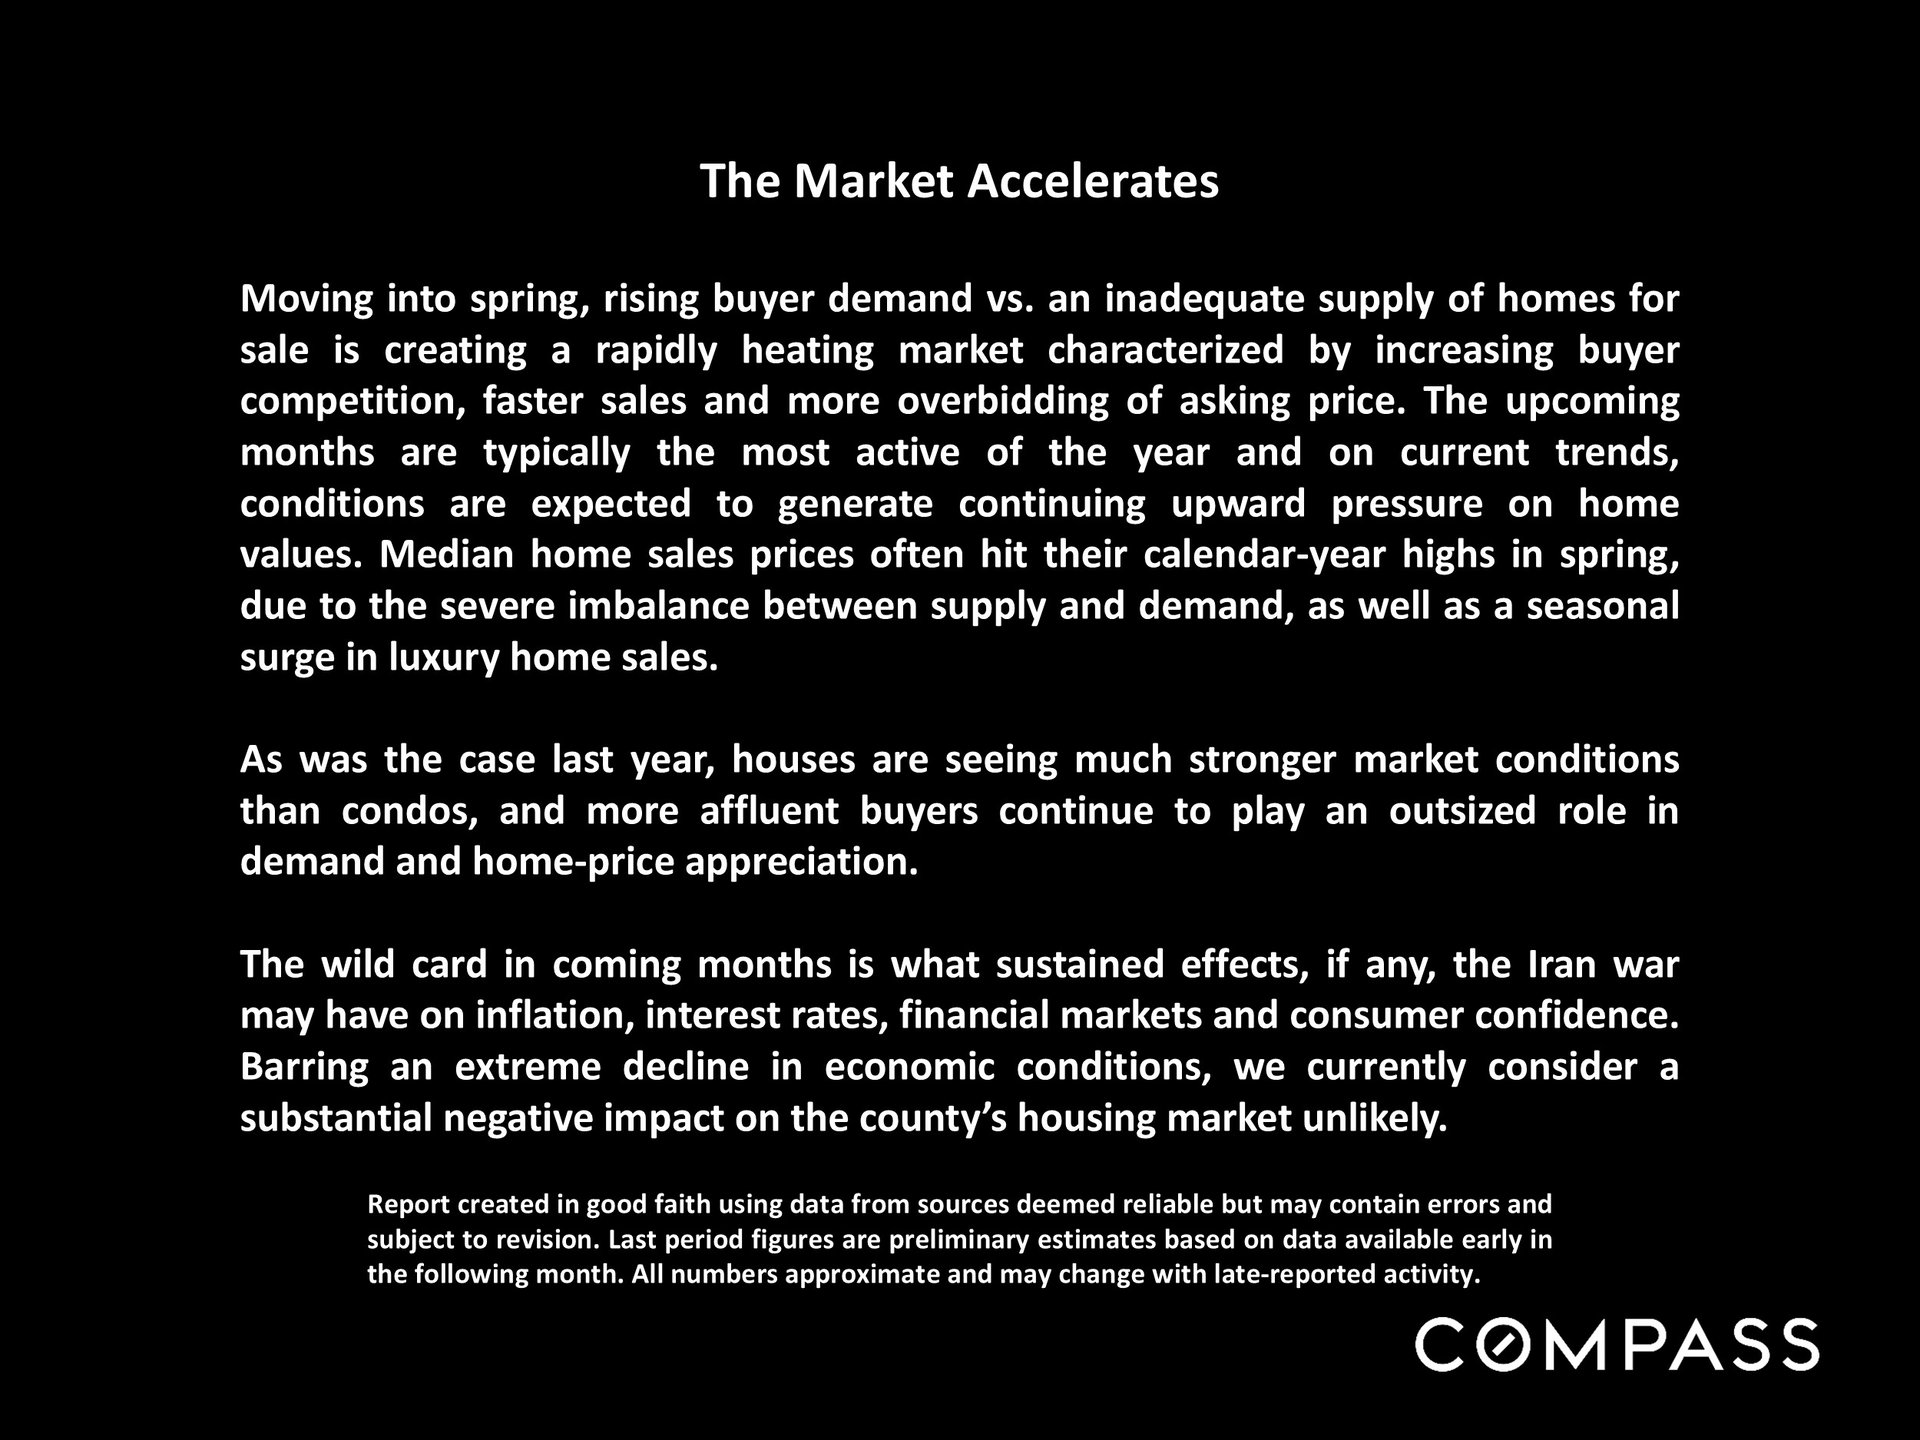
Conclusion
Based on these images alone, San Mateo County entered March 2026 with a clearly accelerating housing market. Demand is rising faster than supply, inventory remains somewhat constrained, and overbidding has increased materially, especially for houses. Single-family homes continue to outperform condos in both pricing power and buyer competition, while affluent buyers remain a major force in the market.
Mortgage rates are still relatively low by recent standards, helping fuel activity, though the recent rise in oil prices and the early uptick in daily mortgage rates introduce some uncertainty. Even so, the overall picture from these slides is of a market gaining momentum as it moves into its most active seasonal period.